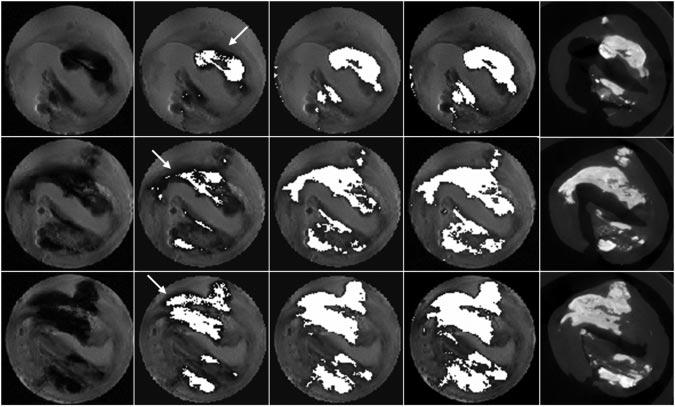
Figure 1.

MRI mineral volume calculation. PDW image, 4 and 8× background noise threshold segmented images, k-means clustering segmented image, and micro-CT images are shown (left to right) for 3 locations (top to bottom). In some regions, visually apparent mineralization was not segmented, especially for the lower threshold (white arrows).
