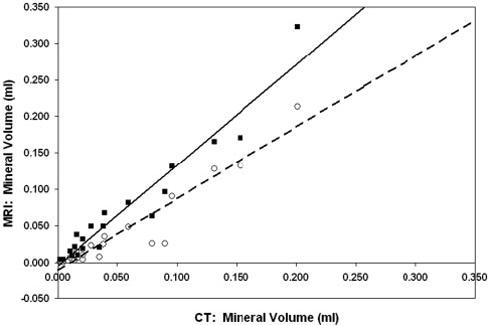
Figure 4.

MRI threshold method at 4×background noise vs CT (○), with linear fit (dashed line): VMRI=-0.01+0.98VCT; R2=0.90; F=166.62; P<0.0001. MRI k-means clustering method versus CT (■), with linear fit (solid line): VMRI=-0.005+1.38VCT; R2=0.93; F=243.00; P<0.0001.
