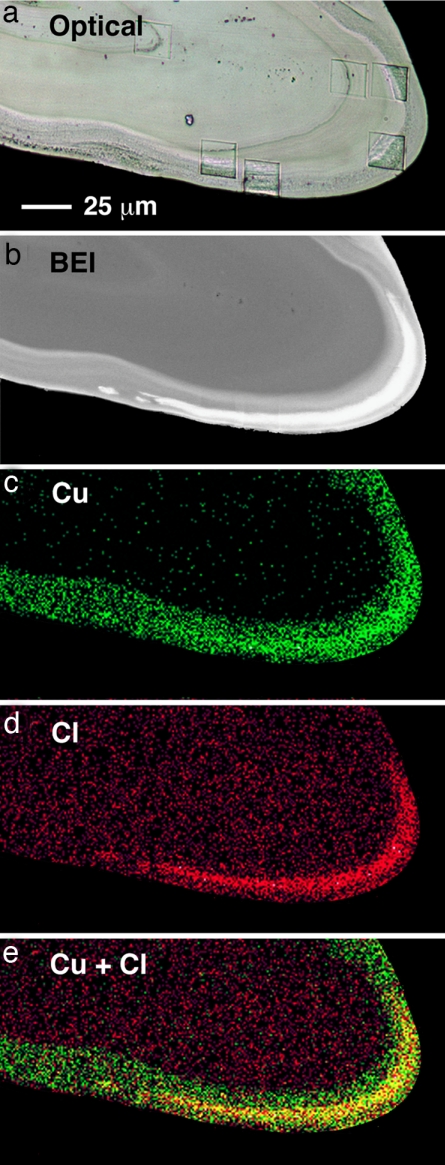
Fig. 2.
Optical and backscatter electron (BEI) images of the near-tip region of a microtomed Glycera jaw along with corresponding Cu and Cl distributions, obtained by EDS. Superposition of the Cu and Cl distributions (in e) reveals the atacamite-containing regions (shown in yellow). Square features in a are a remnant of wear tests.

