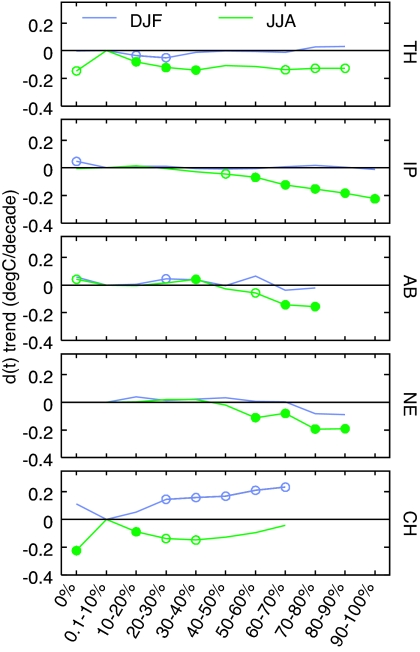
Fig. 5.
Observed 1950–2000 June–August (JJA) and December–February (DJF) Tmax trends in regions partitioned by CIF classes, relative to a reference class (0.1–10% CIF) for five irrigated regions, by using the PRISM data set for the Nebraska (NE) region and CRU2.1 for the four other regions. Filled/open circles indicate that the trend of d(t) is statistically significant at P < 0.01/0.05. TH, Thailand; IP, Indo-Gangetic Plains of India and Pakistan; AB, Aral Sea Basin; CH, Eastern China.

