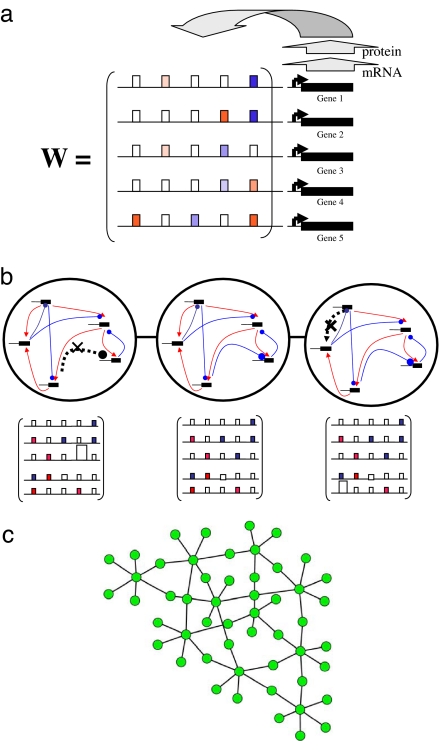
Fig. 1.
Neutral networks in transcriptional regulation. (a) A transcriptional regulation network. Solid black bars indicate genes that encode transcriptional regulators in a hypothetical network of five genes. Each gene is expressed at a level that is influenced by the transcriptional regulators in the network. This influence is usually exerted through the binding of a transcriptional regulator to a gene's regulatory region (horizontal line). The model represents the regulatory interactions between transcription factors j and genes i through a matrix w = (wij). A regulator's effect can be activating (wij > 0, red rectangles) or repressing (wij < 0, blue rectangles). Any given gene's expression may be unaffected by most regulators in the network (wij = 0, white rectangles). The different hues of red and blue correspond to different magnitudes of wij. The highly regular correspondence of matrix entries to binding sites serves the purpose of illustration and is not normally found, because transcription factor binding sites usually function, regardless of their position in a regulatory region. (b) The topology on the space of genotypes induced by single mutations. The center network shows a hypothetical network of five genes (Upper) and its matrix of regulatory interactions w (Lower), if genes are numbered clockwise from the uppermost gene. Red arrows indicate activating interactions, and blue lines terminating in a circle indicate repressive interactions. The leftmost network and the center network differ in one repressive interaction from gene 4 to gene 3 (dashed gray line, black cross, and large open rectangle). The rightmost network and the middle network differ in one activating interaction from gene 1 to gene 5 (dashed line, black cross, and large white rectangle). Each of the three networks corresponds to one node in a graph as indicated by the large circle around the networks. These circles are connected because the respective networks are neighbors; i.e., they differ by one regulatory interaction. [a and b were reproduced with permission from Ciliberti et al. (31) (Copyright 2007, Public Library of Science)]. (c) The neutral network for a given phenotype. Each node corresponds to a network of a given topology, and two nodes are connected by an edge if they differ at one regulatory interaction (n = 3 genes, 4 ≤ M ≤ 5 regulatory interactions, and Hamming distance of S(0) and S∞ of d = 2/3). This neutral network is connected and the number of edges incident on a node is highly variable. Note that neutral networks for greater numbers of genes typically have a huge number of nodes. The number of nodes in a neutral network can be counted, because different nodes differ only in the signs of their regulatory interactions.

