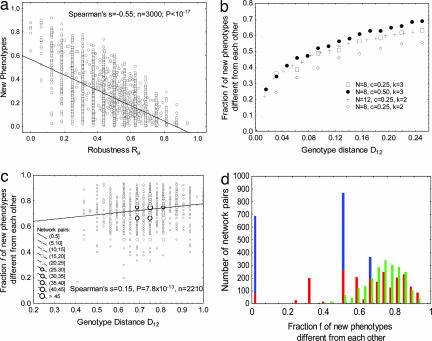
Fig. 2.
The ability to innovate depends on a genotype's position in the neutral network. (a) A tradeoff between robustness and innovation. The horizontal axis shows mutational robustness Rμ, the fraction of a network's w topological neighbors that share the same equilibrium expression state, S∞, with w. For each network w whose robustness is displayed on the horizontal axis, the vertical axis shows the fraction of networks of genotype distance D < 0.1 around w, whose equilibrium state is different from S∞. This fraction declines with increasing robustness. n = 8, c = 0.25, and d = 0.5. (b) The horizontal axis shows genotype distance D12 of two networks (w1 and w2) with the same phenotype. The vertical axis shows the mean fraction f of unique new phenotypes, as defined in the main text, found in a k-neighborhood (see legend for k) around these networks. If f is close to zero, then all or most of the phenotypes of networks in the two neighborhoods are identical. If f is close to one, then almost all phenotypes in the two neighborhoods are different. Standard deviations around each data point are no greater than 8 × 10⁻³. (c) Like b, except for a sample of 2,210 network pairs (w1 and w2) chosen at random from the neutral network and with mutational robustness Rμ in the interval (0.45, 0.60). n = 8, c = 0.25, d = 0.5, and k = 3. As opposed to the strong and positive statistical association between genotype distance and f for networks at small D12, this association is considerably weaker at larger distances. Notice the large fraction of unique new phenotypes for almost all network pairs shown (mean f = 0.73). (d) Histogram of f for 1-neighbors (blue), 2-neighbors (red), and 3-neighbors (green) of 2,210 randomly chosen network pairs with Rμ in the interval (0.45, 0.60). Data are shown for n = 8, c = 0.25, and d = 0.5. For one-mutant neighbors, the robustness Rμ of a network w is the fraction of a network's neighbors that has the same gene expression pattern S∞. For k-neighbors with k > 1, we define Rμ as the fraction of all networks that differ from w by no more than k regulatory interactions and that have the same gene expression pattern S∞.

