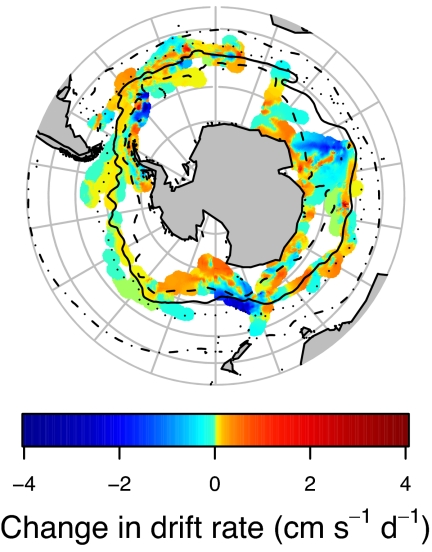
Fig. 3.
Circumpolar map of physiological changes during winter migrations of elephant seals. Daily change in drift rate was calculated for 36 individuals during their winter migrations in 2004 and 2005. Blue shading represents a decrease in vertical change in depth during passive drifts, indicating reduced relative lipid content, whereas green–red shading indicates increased vertical depth change and increasing relative lipid content. Interpolated surfaces were created by using the same mapping as that used for Fig. 2. Differences in coverage between here and Fig. 2 are a result of the fact that drift dives (for which vertical change of depth during passive drifts can be calculated) represent only ≈8–10% of all dives. Thus, this surface is calculated based on a smaller data set than those in Fig. 2.

