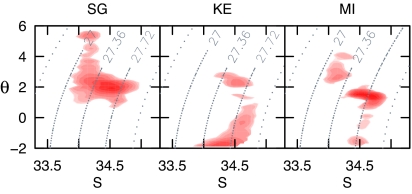
Fig. 4.
In situ θ-S measurements collected by instruments deployed on southern elephant seals at three of the main locations (South Georgia, Kerguelen, and Macquarie Island). The curved dotted lines indicate the water density corresponding to these θ-S properties. The red surfaces represent kernel densities of θ-S properties at the bottom of dives. Initially, two density surfaces were created for each location: one using only those dives occurring during periods of positive change in drift rate (i.e., periods of increasing relative lipid content) and the other based on dives during periods of negative change. The displayed surfaces represent the positive minus negative density surfaces, and the color intensity therefore highlights areas of predominantly increasing lipid content. Kernel surfaces were created by using a 50 × 50 grid over the range of θ and S, yielding a resolution of 0.056 × 0.199 for θ and S, respectively.

