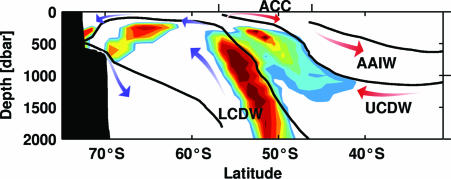
Fig. 5.
Generalized section of the SO, highlighting areas where southern elephant seals are predicted to change their relative body fat stores. We used typical sections of temperature and salinity from the Levitus 1° data set (52). The derived potential density values were matched to those in table 2 in Heywood and King (37) to highlight the main water mass boundaries between AAIW, Upper Circumpolar Deep Water (UCDW), and Lower Circumpolar Deep Water (LCDW). Colored contours represent the accumulated number of matches between temperature, salinity, and derived density values obtained from seals, and corresponding values in the schematic hydrographic section. We used only values at the deepest point of each profile, and only those profiles obtained during periods of positive change in drift rate. The arrows indicate the main circulation pathways as summarized by Toggweiler et al. (53). Note the preference for upwelling regions of Circumpolar Deep Water and water mass transformation regions adjacent to the Antarctic continent, and the avoidance of regions of AAIW subduction. The gradual deepening of predicted regions to the north agrees well with the patterns of daytime and nighttime dive depths shown in Fig. 2.

