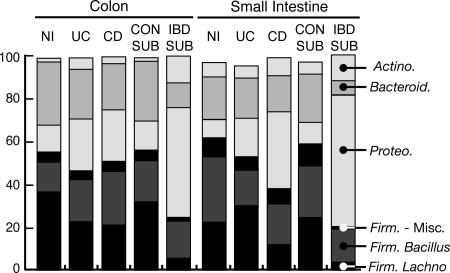
Fig. 2.
Phylum-level comparison of disease state. Bars shading depicts percentages of cloned sequences in all samples of a particular category that belong to one of the predominant phylum of Bacteria identified in the sample set (Firmicutes are subdivided into Bacillus, Lachnospiraceae, and miscellaneous groups). Phyla of lower abundance were omitted, so bars do not sum to 100%. NI, non-IBD control samples; Con-Sub, Control subset; and IBD-Sub, IBD subset are explained in the text.

