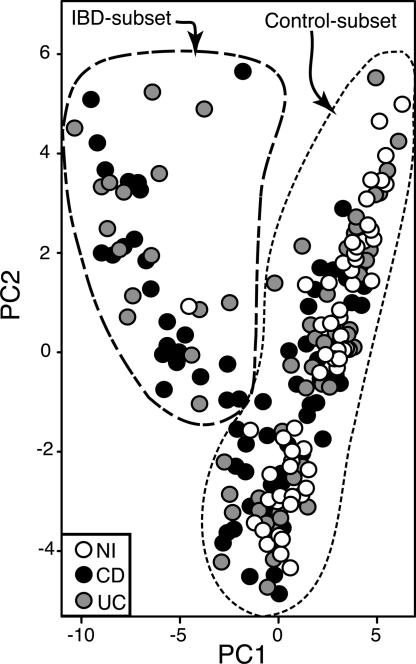
Fig. 3.
PCA; 97% OTUs were encoded as presence/absence data for each sample, and the corresponding data matrix was subjected to PCA. Each circle, which is representative of a single sample and shaded according to disease status, is plotted along the first two principal component axes. Dashed lines denote nominal sample clusters, the Control subset and IBD subset.

