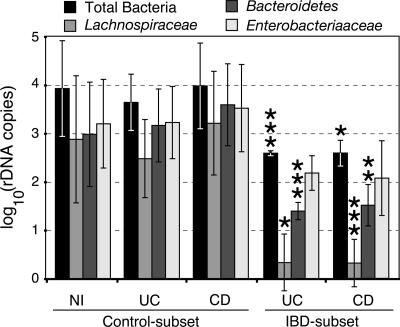
Fig. 4.
Q-PCR analysis of predominant phylogenetic groups. Selected representatives of the Control- and IBD-subset clusters (see text for details) were assayed by Q-PCR for total bacteria, Lachnospiraceae, Bacteroidetes, and Enterobacteriaceae. Experiments were performed in triplicate. Data are presented as log10-transformed SSU rDNA gene copy numbers, as interpolated from standard curves of plasmid controls. Error bars represent standard deviations of replicate experiments. NI, non-IBD controls. Control- and IBD-subset are explained in the text. The results of Student's t tests are indicated as *, P < 0.05; **, P < 0.01; and ***, P < 0.001. t tests compared the results of Control- and IBD-subset samples for a particular disease state and bacterial group (e.g., Bacteroidetes/CD/Control subset vs. Bacteroidetes/CD/IBD subset). Data for specific groups were normalized to total bacteria.

