Fig. 5.
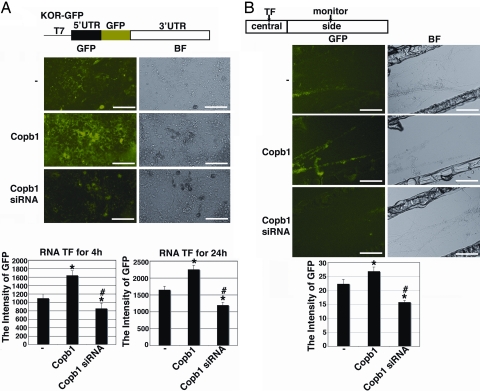
Copb1-stimulated kor mRNA translation. (A) The construct of kor template (KOR–GFP) with its coding sequence replaced, in-frame, with the GFP coding sequence is shown above the micrographs. The micrographs show in vitro synthesized, capped, and polyadenylated KOR–GFP transcript introduced into primary cortical neurons of a control culture (Top), a Copb1-transfected culture (Middle), and a culture receiving Copb1 siRNA (Bottom). GFP signals were monitored at 4 and 24 h, and the statistical analyses are shown in the graphs. (B) The diagram above the photographic images represents the central and side compartments of a Campenot chamber. Micrographs show KOR–GFP transcript introduced into the central compartment of the Campenot culture of a control (Top), a culture receiving supplemented Copb1 (Middle), or a culture receiving Copb1 siRNA (Bottom). Only the side chambers are shown. The GFP signals in the side chamber were monitored at 24 h, as shown, and the statistical analysis is shown in the graph. GFP signals are in green (n = 5, *, P < 0.025 for comparing with the control; #, P < 0.025 for comparing Copb1 siRNA with Copb1 transfection). (Scale bars, 50 μm.)

