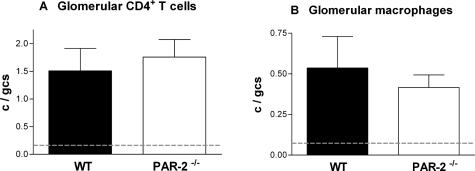
Figure 4.
Glomerular accumulation of CD4+ T cells demonstrated by staining with mAb GK1.5 (A) and CD68+ macrophages demonstrated by staining with mAb FA/11 (B) was not different in PAR-2-deficient and WT mice on day 21 of disease. The dotted lines represent the mean glomerular T cell and macrophage numbers in normal mice.

