
FIGURE 3.
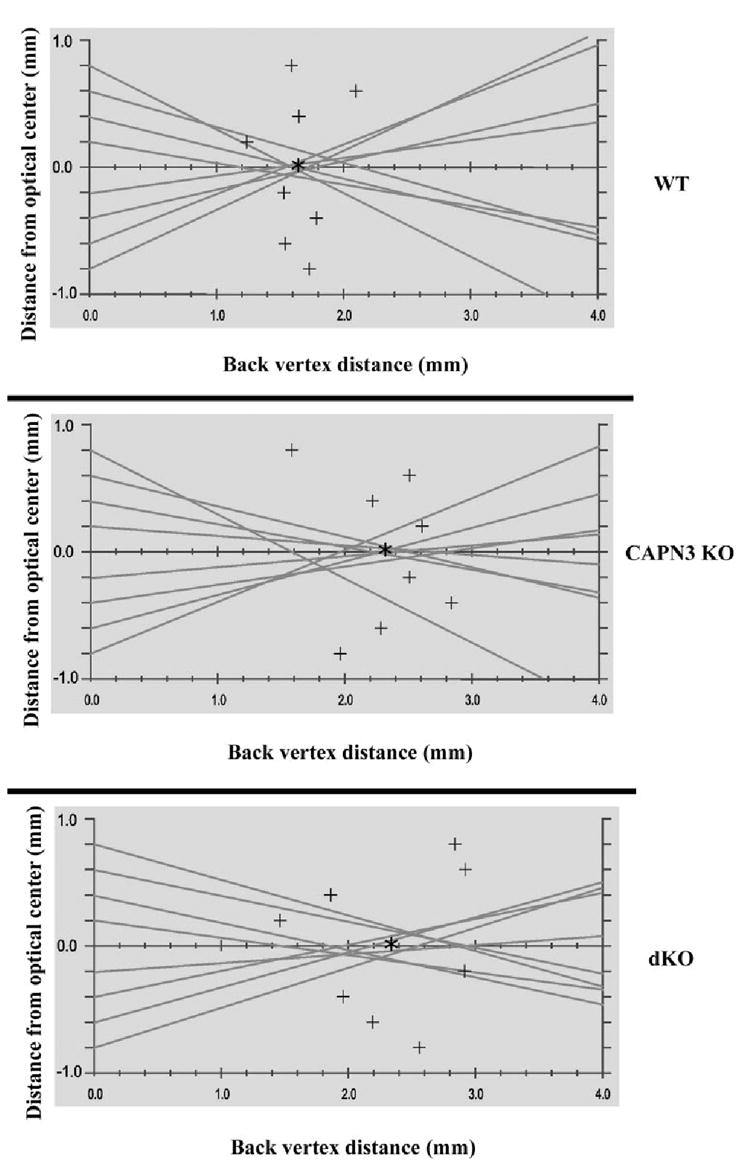
Representative laser scan profiles from the different KO mouse lenses. Shown are a typical profile of lenses from 7.5-week-old wild-type, CAPN3−/−, and dKO mice. Lines: the pathway of the laser beam and the data points (+)represent the focal point of each beam. The average BVD (asterisk) is calculated from averaging the value of each of these data points, whereas the variability in the BVD is the SEM. Both CAPN3−/− and dKO lenses showed an increase in the average BVD, as well as an increase in the scatter of the data points around each of the means.