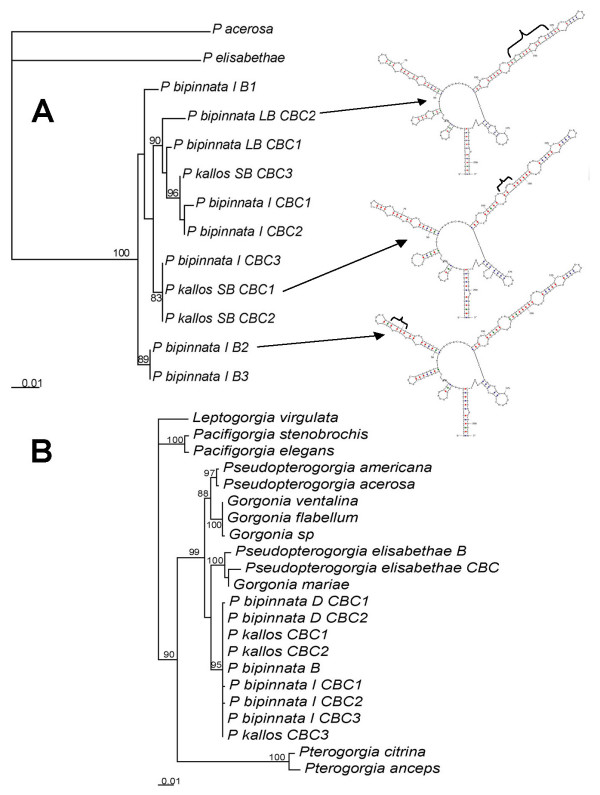
Figure 2.
Phylogenetic hypotheses of gorgonian corals (phylograms). A. Nuclear DNA (ITS1–5.8s-ITS2, 731 bp) maximum likelihood tree using the best-fit model (TVMef+G) selected by AIC. Arrows indicate the species ITS2 secondary structure with their different morphologies. B. Mitochondrial DNA (MSH1 776 bp), maximum likelihood tree using the best-fit model (K81uf+I) in PAUP* selected by Akaike Iinformation Criterion-AIC in Modeltest. Above node support values are from 100 bootstrap replicates (>75 only). Maximum parsimony analyses yielded the same results. Scale in substitutions per site. B = Bahamas, CBC = Carrie Bow Cay, Belize, I = Typical Intermediate morphotype, D = Deep water morphotype. SEM scale = 20 μm. Additional mtDNA sequences from [4].

