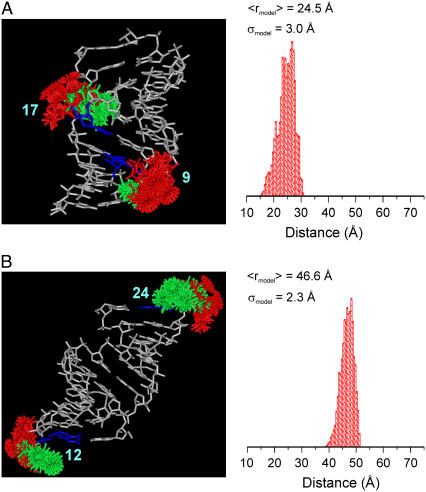
FIGURE 4.
Ensembles of allowable R5 conformations modeled at sites (9;17) (A) and sites (12;24) (B) of the SDR RNA. The RNA is shown in white, with the labeled nucleotides shown in blue. Conformers attached to the Sp diastereomer are shown in red, and those attached to the Rp diastereomer are in green. On the right is a histogram of the predicted distance distribution, with the average distance (〈rmodel〉) and width of the distribution (σmodel) shown.

