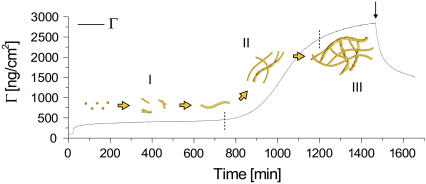
FIGURE 7.
Modeled surface mass density (Γ) according to the extended viscoelastic Kelvin-Voigt model, throughout the three characteristic regimes observed (I, II, and III) for a representative experiment, along with an illustration of dynamic interfacial fibrillation. Note the intuitively correct behavior modeled at the end-of-experiment flushing (arrow), showing a characteristic desorption behavior.

