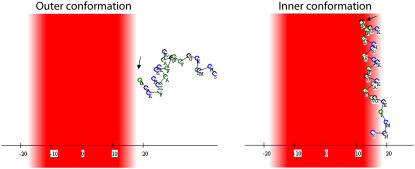
FIGURE 7.
Representatives of the “outer” (left) and “inner” (right) conformations of the Mag2 simulation of Fig. 6 A. The membrane hydrophobicity profile is color-coded so that dark-red represents the most highly hydrophobic region of the lipid chains, pale-red represents the membrane-water interface, and the aqueous phase is white. The hydrophobic residues are marked in green and the rest of the residues in blue. The peptide's N-terminus is marked with an arrow.

