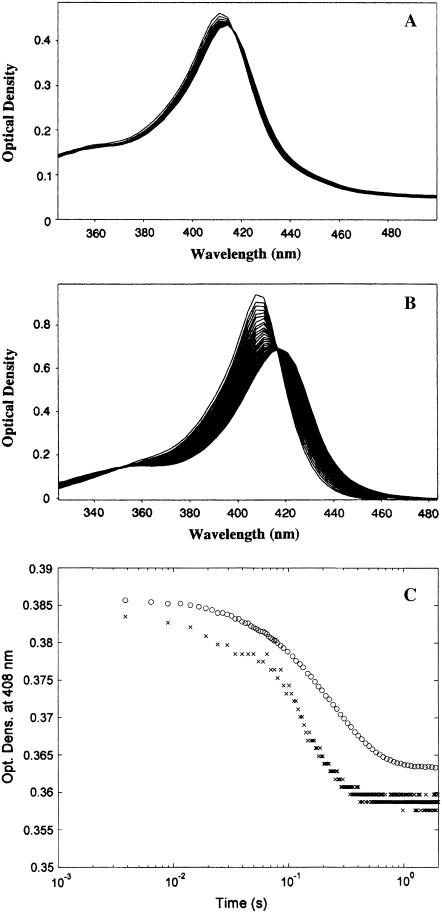
FIGURE 3.
Kinetics of azide binding to HHMb and mini Mb. (A) Temporal evolution of absorption spectra over the first 0.3 s during the reaction of ferric mini Mb with 5 mM sodium azide at 20°C. (B) Temporal evolution of absorption spectra over the first 0.3 s during the reaction of ferric HHMb with 5 mM sodium azide at 20°C. (C) Progress curves of absorption changes at 408 nm of the reaction of ferric mini Mb (×) and of HHMb (○) with 5 mM sodium azide at pH 7.0 and 20°C. Optical changes of individual progress curves have been modified for a better comparison between them. For further details, see text.

