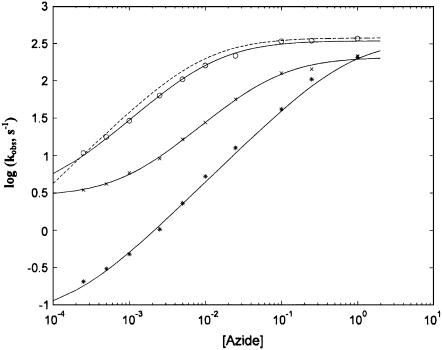
FIGURE 4.
Azide concentration dependence of the observed binding rate constants. Sodium azide concentration dependence of the association rate constants at 20°C for the fast phase of mini Mb (open circles), slow phase of mini Mb (×), horse heart Mb (asterisks) and sperm whale Mb (dashed curve). Continuous lines have been obtained by nonlinear least-squares fitting of data according to Eq. 1 (for the fast phase of mini Mb and horse heart Mb) or Eq. 2 (for the slow phase of mini Mb) employing parameters reported in Table 1. The dashed curve has been obtained employing parameters published previously (15) and reported in Table 1 for comparison. For further details, see text.

