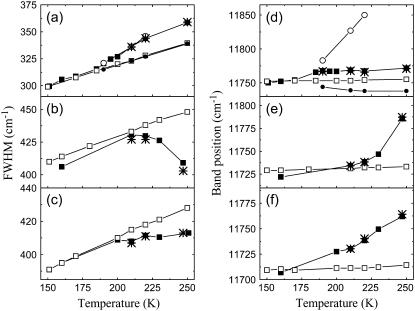
FIGURE 4.
Measured (solid squares) and simulated (with the best fit at low temperatures; open squares) temperature dependences of the FWHM and peak positions of the B850 band of the LH2 complexes in 60% buffer-glycerol solution (a,d), in buffer with water (b,e), and in membranes with 60% buffer-glycerol solution (c, f). Fitting parameters of the B850 band at high temperature takes into account the observed shift of the B800 band position due to the dispersive interaction (see Fig. 2 for the experimental data). Taking into account this shift only, results in a fairly large red shift (solid circles, d). After additional change of the resonance interaction V while keeping the same inhomogeneous broadening Γinh = 362 cm−1, it gives the band shift to the blue side (open circles). Here is the best fit (stars) obtained when taking into account all three factors with dominant contribution from the inhomogeneous broadening (see Table 3 for the obtained fitting parameters).

