
Figure 4.
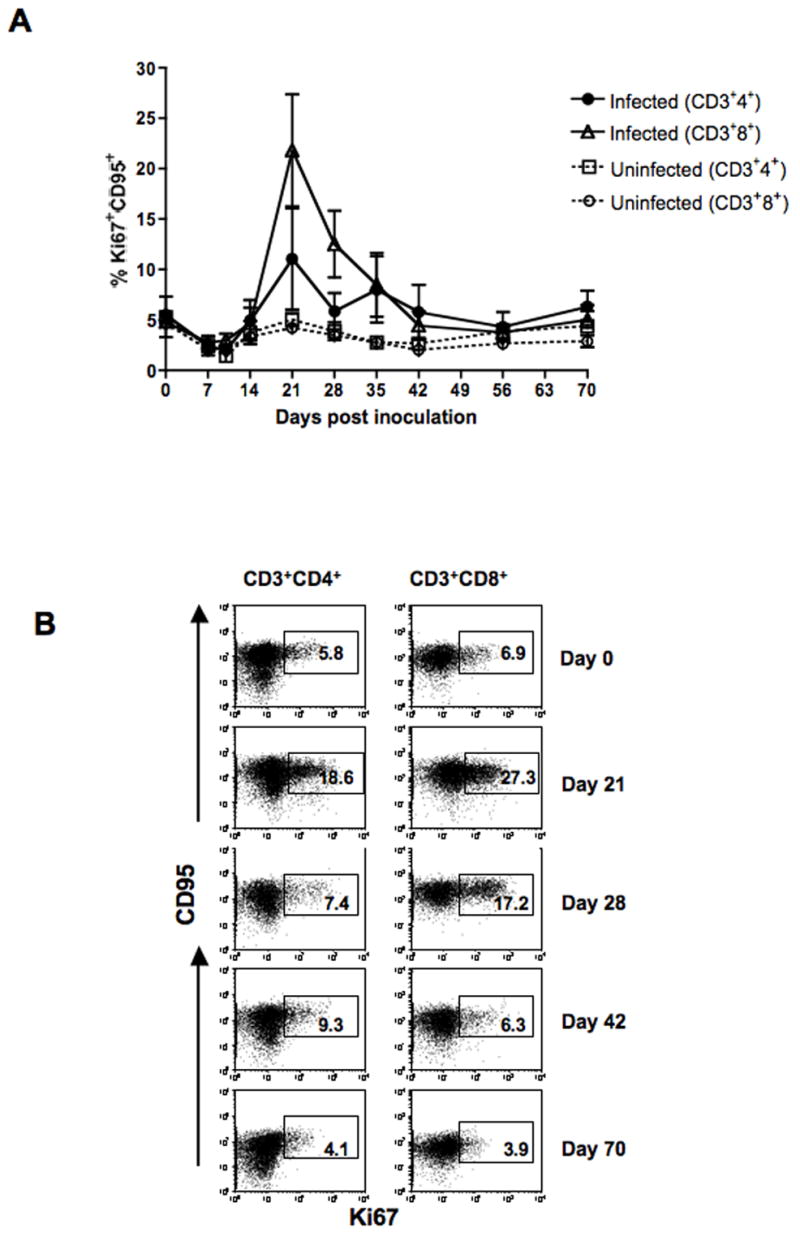
(A). T cell proliferation assessed by %Ki67 expression is shown for CD4+ and CD8+ T cells. Both CD4+ and CD8+ T cell proliferation increased following SHIVsf162p3 infection between 14 to 35 days post inoculation, but returned to baseline levels thereafter. (B). Representative expression of CD95 and Ki67 in CD4+ and CD8+ T cells in blood from a SHIVsf162p3 infected macaque (DT54). Percentages of Ki67+ CD95+ T cells in either CD4+ or CD8+ T cells are shown in the box of each dot plot. Six-color flow cytometry staining was performed to define proliferating T cells as described in Table 1.