
Figure 5.
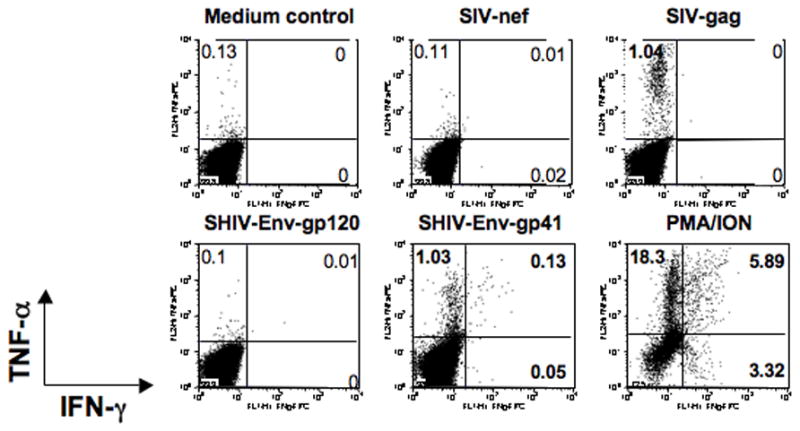
Intracellular cytokine flow cytometry for IFN-γ and TNF-α responses from a representative SHIVsf162p3 infected macaque (L274). PBMC were unstimulated (medium control), or stimulated for 6 h with different peptide pools at day 56 post inoculation. Cells were gated first on lymphocytes followed by CD3+ and then on CD8+ T cells. The percentages of IFN-γ and/or TNF-α positive cells are shown in each quadrant. Bold numbers represent positive responses. Four color CFC staining was performed to define antigen specific cytokine responses as described in Table 1.