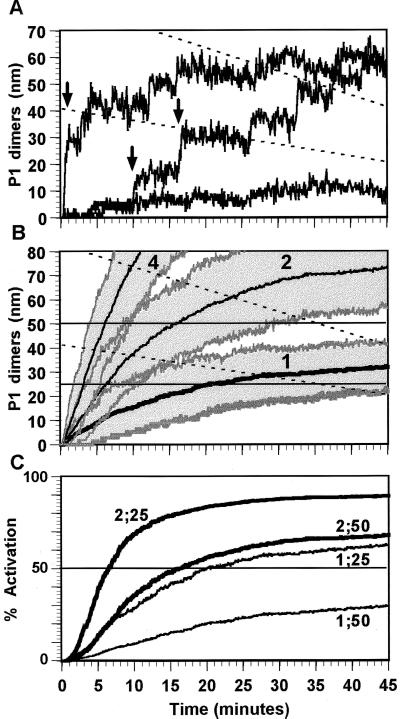
Figure 3.
(A) Three simulation runs for the onset of P1 dimer production for the regulatory configuration in Fig. 1B. Each run is a different realization of the pattern of the dimer concentration growth in an individual cell. The pattern of protein expression can be quite erratic and thus dramatically different in each cell. Rapid changes in dimer concentration due to forward and reverse dimer transitions contribute to the high frequency noise in the protein dimer signal. The broken lines are the declining concentrations equivalent to 25 and 50 dimer molecules in the growing cell. Parameters: P1 dimerization equilibrium constant = 20 nM; dimerization kr = 0.5 s−1; P1 half-life, 30 min. Initial cell volume comparable to E. coli of 1 × 10⁻¹⁵ liters, doubling with linear growth (20) in 45 min (12). (B) Mean and ± 1 σ results for 100 runs at gene dosages of 1, 2, and 4. The “σ” values plotted are the 16th and 84th concentration percentiles at each time point. At higher gene dosages, protein P1 is being produced from more genes; the concentration rises more rapidly, and the effective concentration range will be reached quicker. In addition, the dispersion in time to effectiveness (i.e., the switching delay) will be lower for faster growing signals. (C) Activation level of a controlled promoter (e.g., PRP3 in Fig. 1) assuming activation, A, is characterized by the Hill equation with Hill coefficient 2: A = (Kh[P1P1]2)/(1 + Kh[P1P1]2) where [P1P1] is the P1 dimer concentration and Kh is the Hill association constant, Kh = [KE]−2. Curves are labeled by N;KE, where N is the gene dosage and KE is the dimer-operator binding constant. Each curve reflects only the mean concentration curve plotted in B. Activation (or repression) of controlled genes in each cell and over the population will differ widely around this mean value as shown in A and B.

