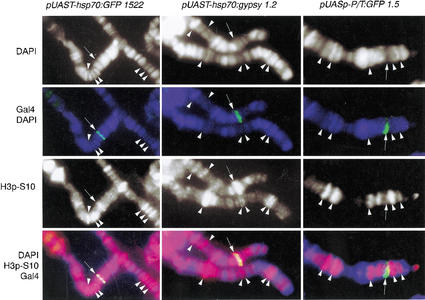
Figure 2.
Correlation between histone H3 phosphorylated at Ser 10 and expression of various transgenes. Phosphorylated H3-Ser 10 is shown in red, Gal4 in green, and DAPI in blue. Arrows point to the localization of each transgene. Arrowheads show colocalization of polytene chromosome interbands (no DAPI staining) and phosphorylated H3.

