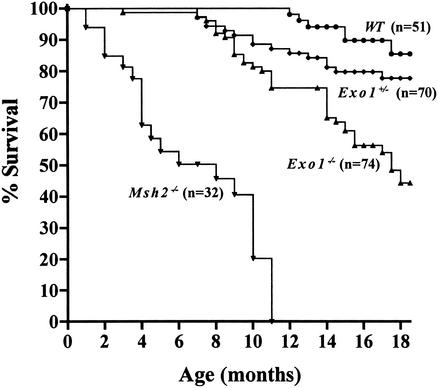
Figure 3.
Survival of Exo1 mutant mice. The survival curve was generated using the Prism (GraphPad Prism 2.0) software package. The differences between the Exo1−/− versus Exo1+/+ and Exo1+/− curves are significant (p < 0.0001 and p = 0.0012, respectively). The difference between the Exo1+/− and Exo1+/+ curves is not significant (p = 0.2937). For comparison, the survival of Msh2−/− mice on similar genetic background is shown (Smits et al. 2000). Statistical analysis is according to the log rank test.

