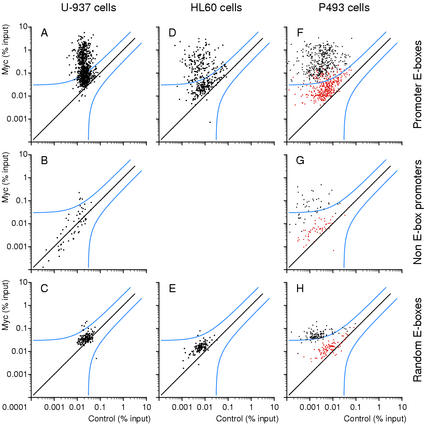
Figure 2.
Myc associates with specific genomic sites. ChIP analysis of Myc binding in U-937 (A–C), HL60 (D,E), and P493 (F–H) cells. The sequences amplified were promoter-associated E-boxes (A,D,F), promoters that do not contain E-boxes (B,G), and random E-boxes (C,E,H) on Chromosome 21. The accession numbers, primers, and data are given in Supplementary Tables A–C. Each data point represents recovery of a given DNA site in the Myc IP (Y-axis) and control precipitation (X-axis). (% input) DNA recovery for each site was quantified as the percentage of input chromatin (Frank et al. 2001). P493 cells were analyzed in the presence of tetracycline (red dots) or 8 h after its removal (black dots).

