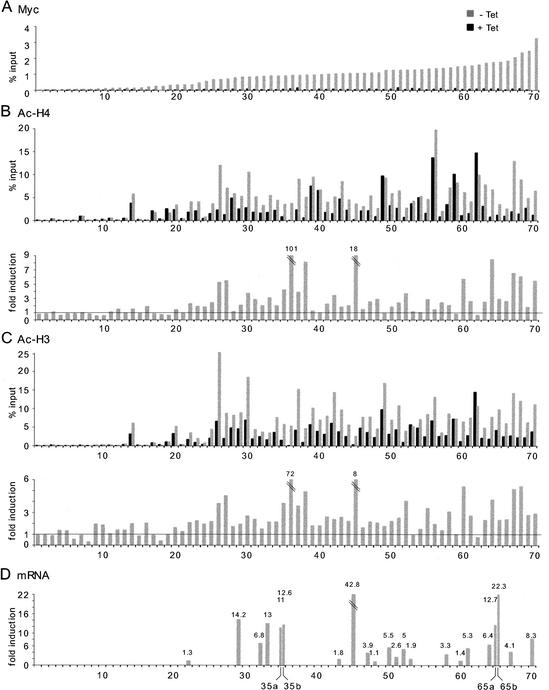
Figure 7.
Analysis of Myc binding, histone acetylation, and gene expression in P493 cells. The list of 70 loci and the corresponding ChIP data are given in Supplementary Tables D and A, respectively. (A) Myc binding to selected loci before (black bars) and after (gray bars) Tet removal. Aligned below this graph is shown ChIP data on acetylation of histone H4 (B) and histone H3 (C). (Upper graphs) Net values (% input). (Lower graphs) Fold induction in acetylation following Myc activation. (D) mRNA induction for selected genes following Myc activation. The maximal induction level over a time course of 12 h is given for each gene. Genes that were equally induced by seeding in fresh Tet-containing medium were removed from this analysis. Several control genes showed constant mRNA levels in all the samples (data not shown). The primers for mRNA analysis are listed in Supplementary Table D.

