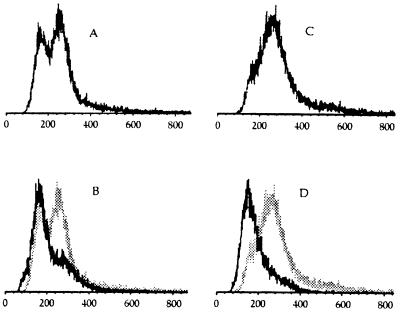
Figure 5.
Effect of α-factor on wild-type and Ku p70-deficient yeast. FACS profiles of wild-type and hdf1Δ null cells were incubated at 20°C before (A and C) and after (B and D) 6-h treatment with α-factor. Wild-type profiles are shown on the left (A and B); hdf1Δ null profiles on right (C and D). B and D show the 6-h α-factor arrest FACS profile in black superimposed on the FACS profiles from A and C, respectively, in gray.

