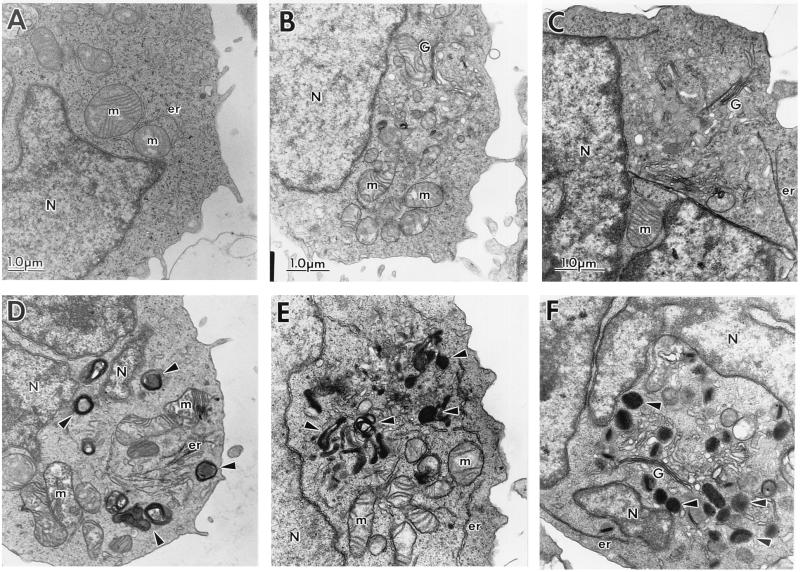
Figure 2.
Electron micrographs of the subcellular morphology of control and SIVmac239 Nef-expressing human T cells. SIVmac239 Nef-expressing and control human T cell lines were fixed and sectioned for examination by EM. Shown are control CEM-SS (CEM-SS/cat, A) and CEM-SS/SIVmac239 Nef cells (D); Jurkat (B) and Jurkat/SIVmac239 Nef cells (E); SupT1 (C) and SupT1/SIVmac239 Nef cells (F). The magnification of each pair is indicated by the scale bars in A–C. Representative intracellular structures are marked: G, Golgi complex; m, mitochondria; N, nucleus; er, endoplasmic reticulum. Arrowheads note representative vesicles in Nef-expressing cells.

