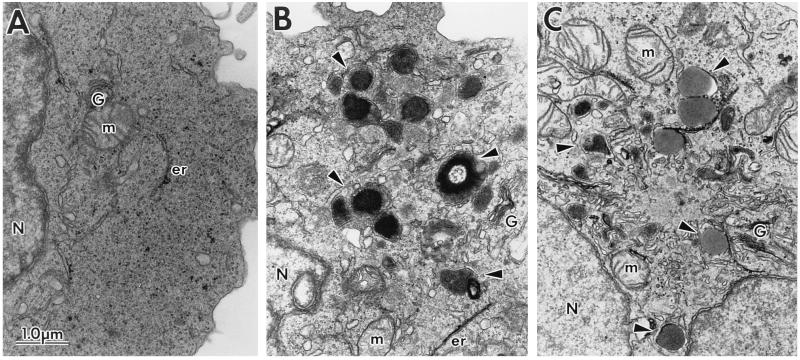
Figure 3.
Electron micrographs of the subcellular morphology of control and HIV-1 Nef-expressing CEM-SS cells. CEM-SS cells transduced with HIVfen (A), expressing HIV-1NL43 Nef (B) or HIV-1cons Nef (C) were fixed and sectioned for visualization by EM. G, Golgi; m, mitochondria; er, endoplasmic reticulum; N, nucleus. Arrowheads mark representative vesicles in Nef-expressing cells.

