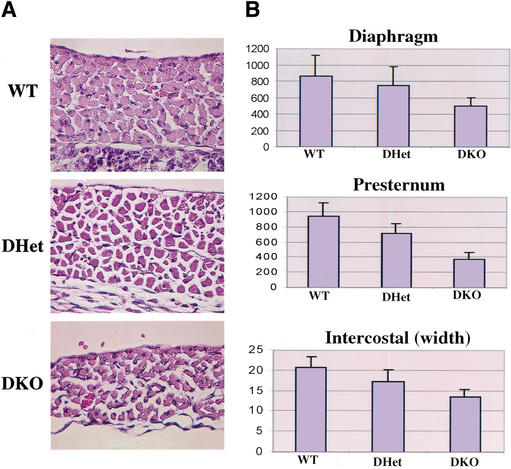
Figure 3.
Skeletal muscle atrophy in Akt1/Akt2 DKO mice. (A) Images of standard H&E-stained diaphragms from WT, DHet, and DKO E18.5 littermate embryos (630× magnification). (B) Histograms showing the size and diameter of muscle cells. Digitized images of skeletal muscles were analyzed as described in Materials and Methods. Results are mean ± S.E.M., expressed as the number of pixels in cross-sectional areas of diaphragm and presternum muscle cells or within the width of intercostal muscles. Twenty cells in three random fields were analyzed for each. P < 0.05.

