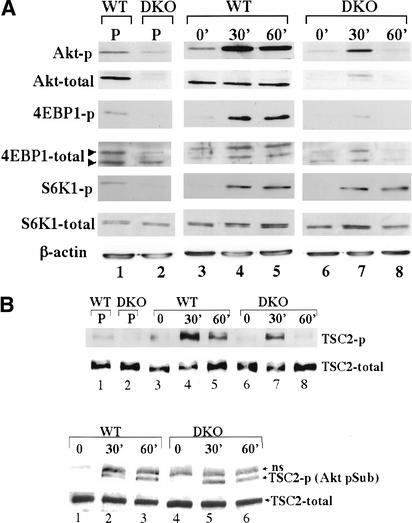
Figure 4.
mTOR activity in WT and DKO MEFs. (A) Phosphorylation and protein levels were determined by immunoblotting. (Lanes 1,2) Proliferating (P) cells (passage 4) were plated in 10% FCS and analyzed 24 h after plating. (Lanes 3,6) Cells were plated in 10% FCS for 24 h, then deprived of serum and analyzed 24 h later. (Lanes 4,5,7,8) After 24 h of serum deprivation, cells were stimulated with 20% FCS for 30 and 60 min, respectively. Protein extracts from proliferating, serum-deprived, or serum-stimulated cells were subjected to immunoblotting using anti-phospho-Ser 473 of Akt (Akt-p), anti-pan-Akt (Akt-total), anti-phospho-Ser 65 of 4E-BP1 (4E-BP1-p), anti-4E-BP1 (4E-BP1-total), anti-phospho-Thr 389 of S6K1 (S6K1-p), anti-S6K1 (anti-S6K1), or anti-β-actin (loading control). (B, top panel) TSC2 phosphorylation was determined by immunoblotting using anti-phospho-Thr 1452 of TSC2. (Bottom panel) Immunoprecipitation with anti-TSC2 followed by immunoblotting with anti-Akt-p-S/T substrate. ns, nonspecific band. (Lanes 1,4) Cells were plated in 10% FCS for 24 h and then deprived of serum and analyzed 24 h later. (Lanes 2,3,5,6) After 24 h of serum deprivation, cells were stimulated with 20% FCS for 30 and 60 min, prior to analysis.

