Figure 1.
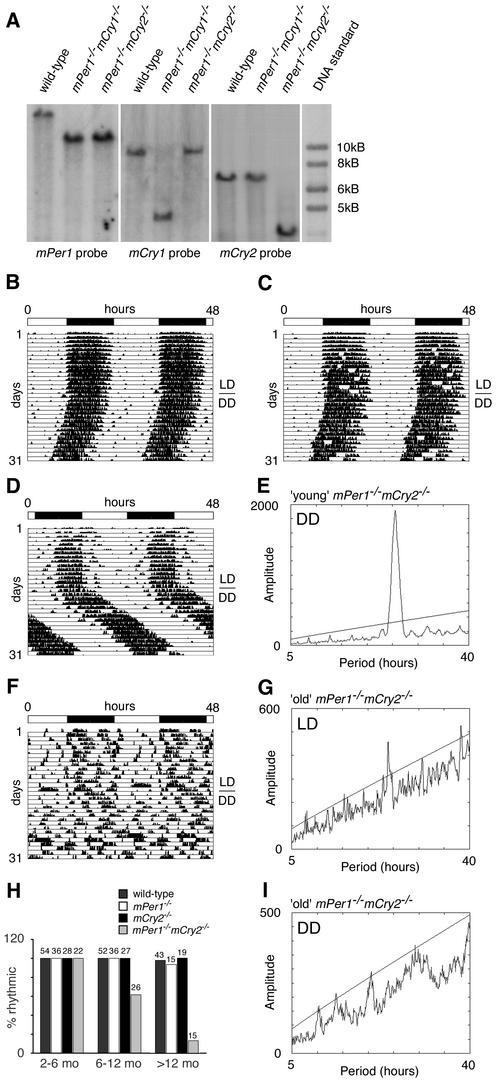
Generation of mPer1mCry double-mutant mice and representative locomotor activity records. (A) Southern blot analysis of wild-type, mPer1-/- mCry1-/-, and mPer1-/- mCry2-/- tail DNA. The mPer1 probe hybridizes to a 20-kb wild-type and a 11.8-kb mutant fragment of EcoRI-digested genomic DNA. The mCry1 probe detects a 9-kb wild-type and a 4-kb NcoI-digested fragment of the targeted locus. In mCry2 mutants, the wild-type allele is detected by hybridization of the probe to a 7-kb EcoRI fragment, whereas the mutant allele yields a 3.5-kb fragment. (B–D,F) Representative locomotor activity records of wild-type (B), mPer1-/- mCry1-/- (C), young mPer1-/- mCry2-/- (D), and old mPer1-/- mCry2-/- (F) animals kept in a 12-h light/12-h dark (LD) cycle and in constant darkness (DD; transition indicated by the horizontal line). Activity is represented by black bars and is double-plotted with the activity of the following light/dark cycle plotted to the right and below the previous light/dark cycle. The top bar indicates light and dark phases in LD. For the first 5 d in DD, wheel rotations per day were 20,000 ± 2500 (n = 17) for wild-type animals, 21,500 ± 7300 (n = 15) for mPer1-/- mCry1-/- mutants, 25,100 ± 6200 (n = 14) for young mPer1-/- mCry2-/- mutants, and 17,200 + 7900 (n = 9) for old mPer1-/- mCry2-/- mutants. (E,G,I) Periodogram analysis of young mPer1-/- mCry2-/- animals in DD (E corresponds to activity plot in D), and old mPer1-/- mCry2-/- animals in LD (G corresponds to activity plot in F) and DD (I corresponds to activity plot in F). Analysis was performed on 10 consecutive days in LD or DD after animals were allowed to adapt 5 d to the new light regimen. The ascending straight line in the periodograms represents a statistical significance of p < 0.001 as determined by the ClockLab program. (H) Age dependence of rhythmicity in wild-type (dark gray bar), mPer1-/- (white bar), mCry2-/- (black bar), and mPer1-/- mCry2-/- (light gray bar) mice. The animals tested were divided into three groups according to their age (2–6 mo, 6–12mo, and >12 mo old). Rhythmicity in DD was determined by periodogram analysis. The values on top of each bar indicate the total numbers of animals tested per group and genotype.

