Figure 6.
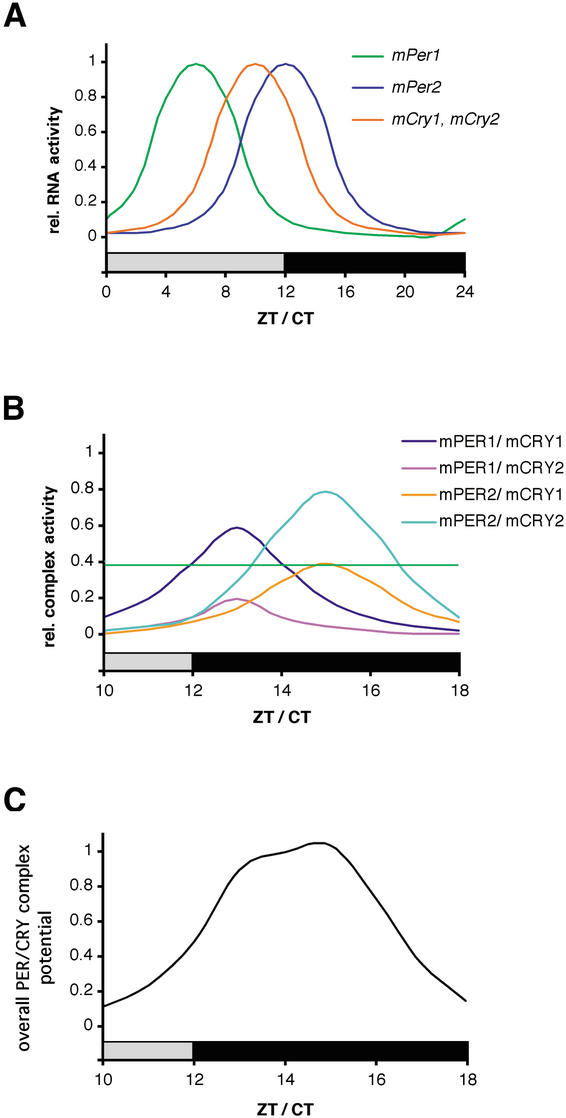
Working model for PER/CRY-driven inhibition of CLOCK/BMAL1. (A) mPer and mCry transcripts show diurnal/circadian cycling in the SCN. Whereas mPer1 expression peaks between ZT/CT 4 and 8, mCry1 and mPer2 mRNA rhythms have their maxima at ZT/CT10 to ZT/CT12, respectively. Note that mCry2 is also expressed in the SCN but without a clearly defined rhythm. Protein peaks are delayed by ∼4–6 h with regard to mRNA. (B) mPER and mCRY proteins form heteromeric complexes that form with certain preferences according to protein–protein affinity and temporal abundance. The complexes are color coded, with mPER1/mCRY1 and mPER2/mCRY2 representing the most abundant ones. The green horizontal line indicates a threshold above which a PER/CRY complex is abundant enough to influence CLOCK/BMAL1 transcription. (C) Time course of the overall inhibitory potential of the mPER/mCRY heteromers on CLOCK/BMAL1 activity. The strong inhibition of CLOCK/BMAL1 during (subjective) night corresponds to the low transcriptional activity of (CLOCK/BMAL1-induced) mPer and mCry genes.

