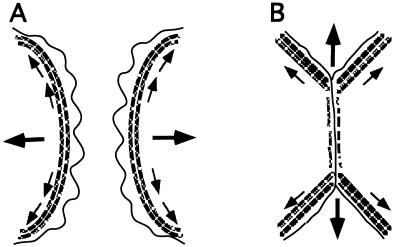
Figure 6.
Model for orientation of traction forces driving contact expansion. (A) Actin organization and force diagram before formation of cell–cell contact. (B) Actin organization and force diagram during cell–cell contact expansion. Stippled lines represent the circumferential bundles of actin filaments, small arrows illustrate the direction of tension along actin filaments, and large arrows show the vectorial sum of tensional forces (see Discussion for details).

