Figure 2.
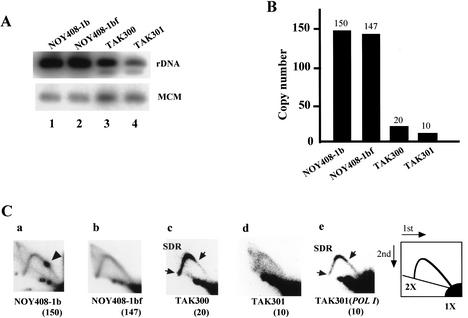
Analysis of low-copy-rDNA strains. (A) Southern hybridization analysis of rDNA copy numbers. DNA was digested with BglII and subjected to electrophoresis followed by Southern analysis using the rDNA probe (Fig. 1). A single-copy gene, MCM2, was used as an internal control for normalization. (B) Quantitation of the intensities of the bands. NOY408-1b (wild-type strain), NOY408-1bf (fob1), TAK300 (fob1; low-copy rDNA strain), TAK301 (fob1 pol1; low-copy rDNA strain). (C) Collision between the transcription and the replication machineries analyzed by 2D gel analysis. DNA was prepared from the strains indicated, digested with BglII and SphI, and subjected to 2D agarose gel electrophoresis followed by Southern hybridization using the rDNA probe (see Fig. 1). A spot indicated by an arrowhead shows accumulation of Y-shaped DNA molecules at the RFB site (panel a). The slowdown region (SDR) is located between two arrows (panel c). The numbers in parentheses are copy numbers of rDNA in each strain. (Panel a) NOY408-1b (wild-type strain). (Panel b) NOY408-1bf (fob1). (Panel c) TAK300 (fob1; low-copy rDNA strain). (Panel d) TAK301 (fob1 pol1; low-copy rDNA strain). (Panel e) TAK301, complemented by a plasmid-borne RPA135 gene (fob1 POLI; low-copy rDNA strain).

