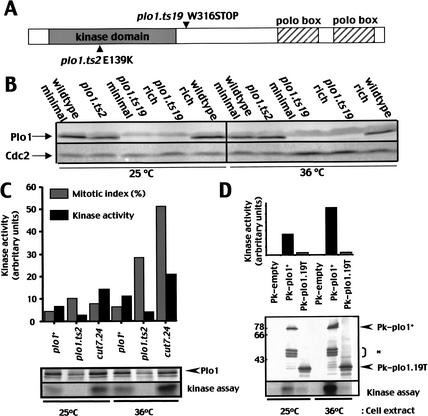
Figure 7.
Plo1 kinase activitywas severely reduced in plo1.ts2 and plo1.ts19. (A) A cartoon indicating the position of the mutations in the plo1 gene. (B) Mid-log-phase cultures of cells grown in either rich or minimal medium were prepared for Western blot analysis to detect Plo1 or p34cdc2 at the temperatures indicated. (C,D) Plo1 kinase assays of wild-type cells containing the plasmids indicated on the graphs after growth to mid-log phase in minimal medium at the indicated temperatures. The level of Plo1 kinase activity per unit of kinase in the precipitate (i.e., specific activity) was plotted to generate the graphs.

