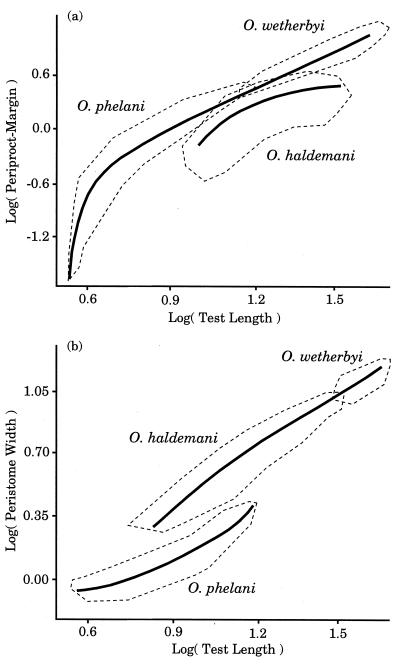
Figure 3.
Allometric trajectories for three species of Eocene Echinoids. Redrawn from McKinney (15), who plots the data points and calculates the best fit polynomial curves through them. Dashed lines show the rough outlines of the actual clouds of data points. Periproct-margin distance is the distance between the anus and the margin of the test. The peristome comprises the mouth and surrounding structures.

