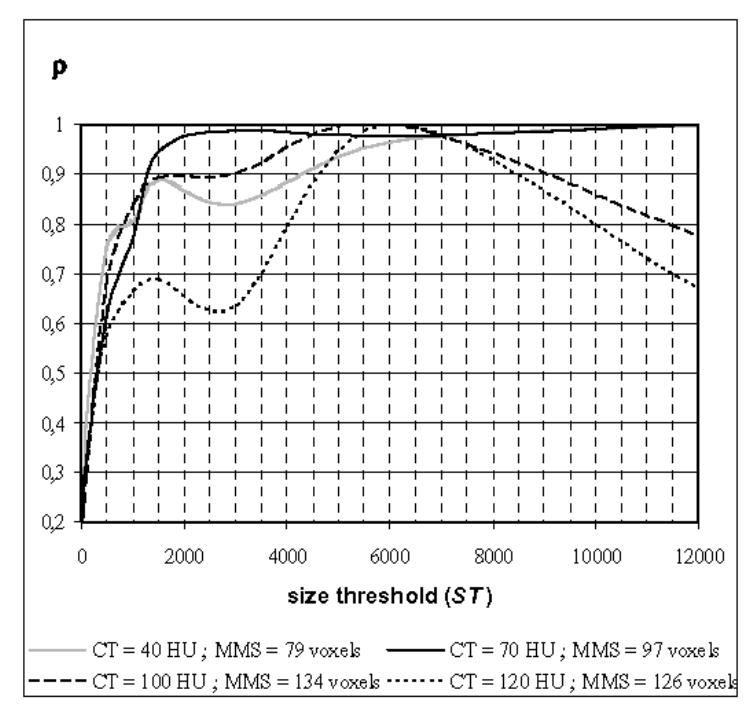
Fig. 4.

Evolution of the relative mean size ρ = MS (CT, ST)/MMS (CT) of the eliminated regions for different values of size threshold ST and contrast threshold CT. MS(CT, ST) is the mean size of the eliminated regions, and MMS(CT) is the maximum of MS(CT, ST) over the range considered for ST when CT is fixed.
