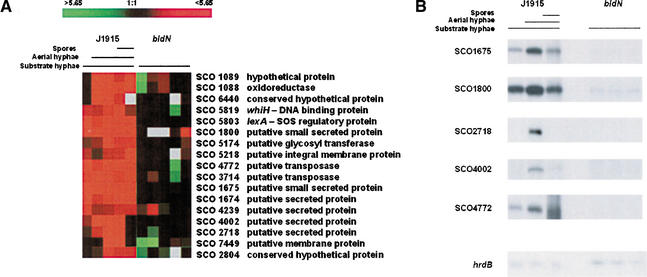
Figure 1.
(A) Expression profiles of genes whose expression differs in a bldN mutant strain and its congenic parent, J1915. Profiles indicate the extent of gene expression in each sample relative to the reference (the first RNA sample/time point taken), with red indicating an increase in transcript abundance and green indicating a decrease, relative to the reference. Black represents unchanged expression levels, and gray indicates the absence of data. (B) S1 nuclease protection assays examining the expression of selected genes from 1A, to confirm dependence of expression on bldN. hrdB was used as a control for RNA integrity and RNA loading levels. The RNA used for these experiments was the same as was used for the microarray analysis shown in A.

