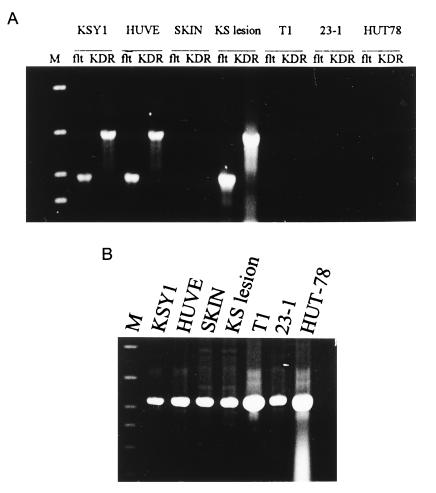
Figure 2.
Expression of Flt-1 and KDR mRNA in KSY1, HUVEC (HUVE), normal skin, and KS tumor tissue from an HIV+ patient, T1 (fibroblast), 23-1 (B lymphoma), and HUT-78 (T cell lymphoma). Equal amounts of RNA were reverse transcribed to generate cDNA. (A) cDNA was subjected to Flt-1- and KDR-specific PCR amplification (498- and 709-bp products, respectively) using paired primers as described. Lane M represents molecular weight markers. (B) cDNA from all samples were subjected to β-actin-specific PCR amplification (548-bp product).

