Figure 4.
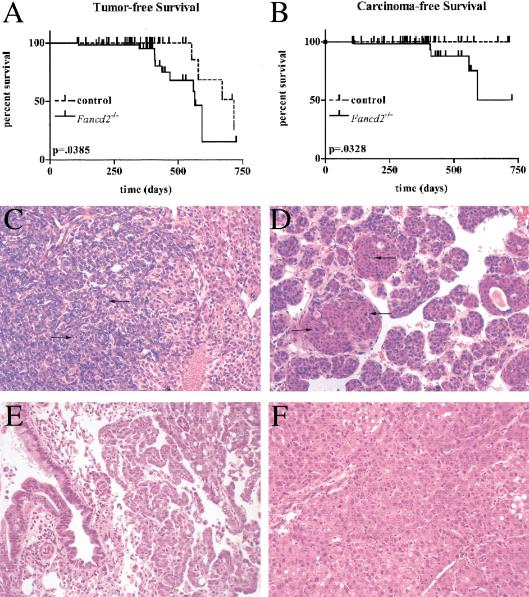
Histology of carcinomas and survival curves for Fancd2 mutants and controls. Tumor-free (A; both adenoma and carcinoma) and carcinoma-free (B; only carcinoma) survival curves are shown for the combination of mixed and 129S4 populations. P values were determined by Logrank test. (C–F) H&E-stained paraffin-embedded sections of tumors from Fancd2–/– animals. Arrows indicate mitotic cells with condensed chromatin. Magnification, 200×. (C) Ovarian adenocarcinoma with large acini lined by tall columnar cells having abundant eosinophilic cytoplasm and highly pleomorphic hyperchromatic nuclei (129S4, 3 mo). (D) Mammary adenocarcinoma in which large clusters of mitotically active and pleomorphic cells were found, ranging from columnar cells to nests of small, undifferentiated cells in clusters (mixed, 13 mo). (E) Lung adenocarcinoma of broncho-alveolar origin, with rows of columnar epithelial cells having a high nucleus-to-cytoplasm ratio lining septa, sometimes forming papillae or filling air spaces (129S4, 13 mo). (F) Hepatocellular carcinoma is multinodular and well differentiated. The neoplastic cells vary from being smaller than normal hepatocytes to 2×–3× larger (mixed background, 18 mo).

