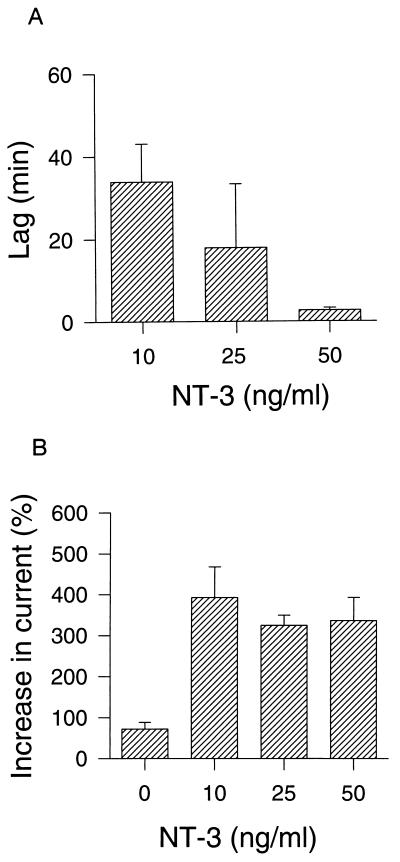
Figure 3.
Dose-response relationships of NT-3-activated BK current. (A) The time lag (i.e., the time from the addition of NT-3 to the onset of the increase in BK current) was determined at different NT-3 concentrations. (B) The maximal NT-3 effect was measured at different NT-3 concentrations and expressed as a percentage of the control current. In the control experiments the BK current was measured 60 min after start of the recording, at which time it had decreased to 75% of the initial value. Data are expressed as mean ± SEM (n = 3–5).

