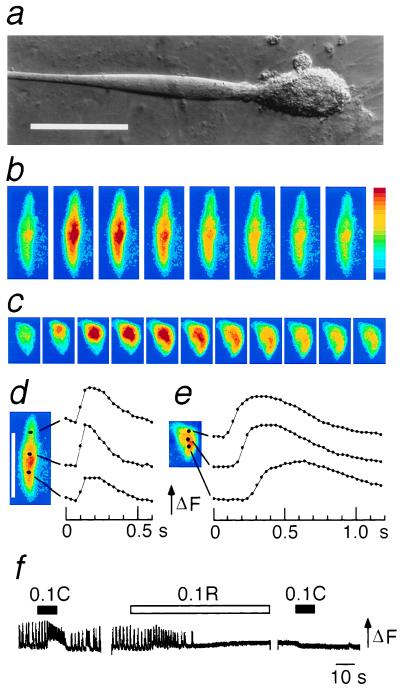
Figure 1.
Intracellular Ca2+ transients in intact dyspedic myotubes expressing RyR-2. (a) Photomicrograph showing the vesiculated appearance of a dyspedic myotube in the region injected with RyR-2 cDNA (enlargement on right). (Bar = 100 μm.) (b and c) Pseudocolor images, separated in time by 67 ms (b) or 100 ms (c), of spontaneous Ca2+ transients in a normal myotube and an RyR-2-injected dyspedic myotube, respectively. Color scale from blue to red indicates increasing Ca2+ concentration in arbitrary units of Fluo-3 fluorescence. (d and e) Fluorescence intensity as a function of time is plotted for the positions indicated on the adjacent images. (d, bar = 500 μm, and applies to b–e.) (f) Spatially averaged Ca2+ responses in a RyR-2-expressing dyspedic myotube; the bars indicate exposure to 0.1 mM caffeine (C) or 0.1 mM ryanodine (R).

