
Figure 8.
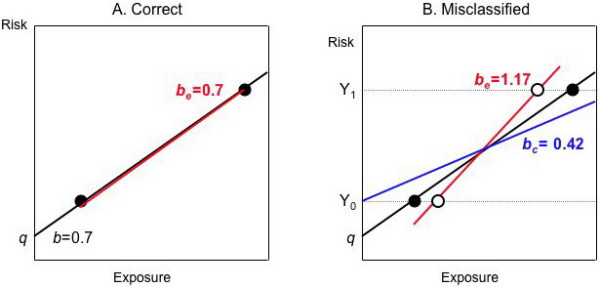
Non-differential exposure misclassification (NDEM), illustrating Table 5. A. If there are no other sources of bias, the ecologic- and individual-level analyses of the correct data are the same. B. Suppose the dichotomous exposure data are misclassified with the same sensitivity and specificity in each group. Then the individual-level result (blue) is biased toward the null and the ecologic result (red) is biased away from the null. The average risks (Yi) in each group are unchanged but the average exposures move closer together. This causes the resulting ecologic regression line to have higher slope.