
Figure 4.
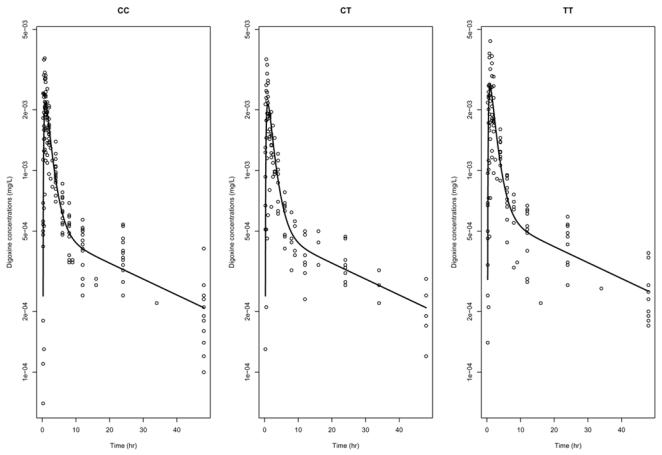
Concentration versus time data for digoxin, for the three genotype classes for exon 26 polymorphism (in log-scale). Overlayed is the line corresponding to the predictions using the population parameters in each group, for men.
Official websites use .gov
A
.gov website belongs to an official
government organization in the United States.
Secure .gov websites use HTTPS
A lock (
) or https:// means you've safely
connected to the .gov website. Share sensitive
information only on official, secure websites.
Concentration versus time data for digoxin, for the three genotype classes for exon 26 polymorphism (in log-scale). Overlayed is the line corresponding to the predictions using the population parameters in each group, for men.