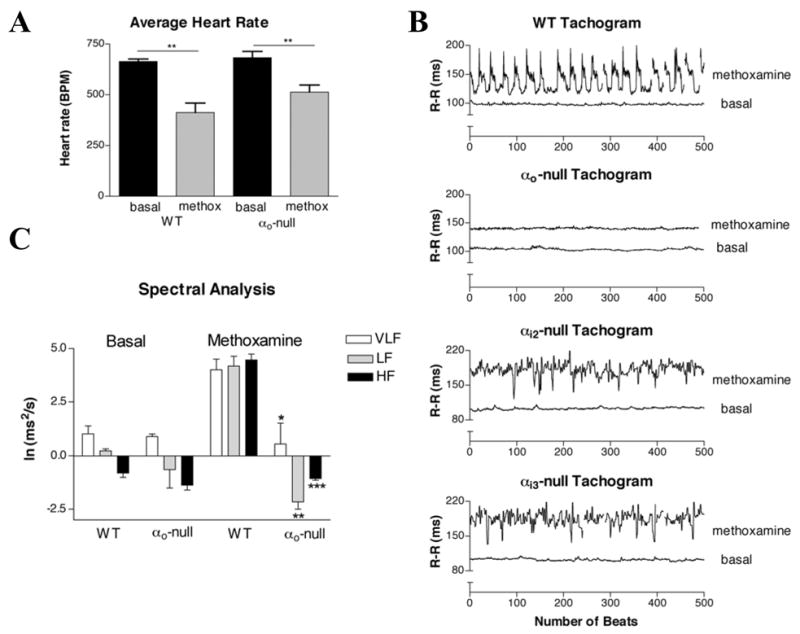
Figure 3. Diminished HRV in αo-null mice responding to methoxamine.

A. In vivo heart rates before and after methoxamine. Heart rates were measured using implantable EKG telemetry devices at baseline and after the injection of 6 mg/kg methoxamine. n=4 for each group. ** P < 0.01. B. Decreased HRV in the αo-null mice compared to their WT littermates after methoxamine stimulation. Mice were chronically maintained EKG telemetry implants as described in methods. Data of the R-R intervals between successive beats before and after addition of methoxamine were collected continuously. C. Quantification of HRV data in αo-null and WT mice. Measurement of the power spectra was broken into three components: high frequency (HF) 1.5–4 Hz; low frequency (LF) 0.4–1.5 Hz; and very low frequency (VLF) <0.4 Hz. * P < 0.02 vs. WT VLF; ** P < 0.002 vs. WT LF; *** P < 0.0001 vs. WT HF.
