
Figure 1.
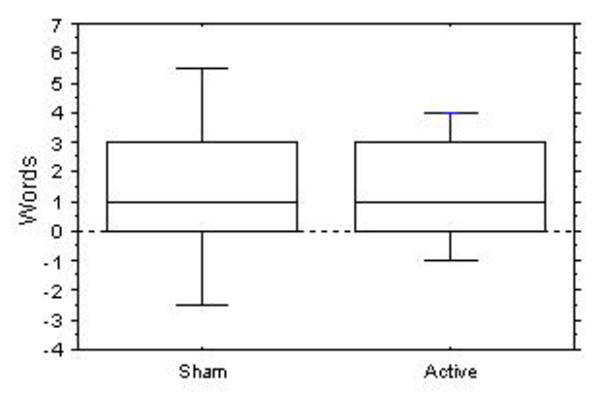
Difference in letter-cued verbal fluencies before and after sham and actual treatment. Bars represent the 90th and 10th, and boxes the 75th and 25th, percentiles. Center line is the median.
Official websites use .gov
A
.gov website belongs to an official
government organization in the United States.
Secure .gov websites use HTTPS
A lock (
) or https:// means you've safely
connected to the .gov website. Share sensitive
information only on official, secure websites.
Difference in letter-cued verbal fluencies before and after sham and actual treatment. Bars represent the 90th and 10th, and boxes the 75th and 25th, percentiles. Center line is the median.